
DIO Calculator: Days Inventory Outstanding, Inventory Turnover and Cash Conversion Cycle

Days inventory outstanding (DIO) is the average number of days your stock sits before it is sold. DIO = average inventory ÷ cost of goods sold × days in the period. A lower DIO means less cash tied up on your shelves. Use the calculator below to get DIO, inventory turnover and your full cash conversion cycle in one place.
Key takeaways
- DIO and inventory turnover measure the same thing from two sides: DIO = days ÷ turnover.
- Always use cost of goods sold, not sales, and the same period for every figure.
- The cash conversion cycle adds customers and suppliers: CCC = DIO + DSO − DPO.
- Each day of DIO holds roughly one day of cost of goods sold in cash.
What is days inventory outstanding (DIO)?
Days inventory outstanding tells you how long, on average, you hold inventory before you sell it. It is also called days sales of inventory (DSI) or days in inventory. Retailers, distributors, restaurants and manufacturers use it to see how fast stock turns back into cash. A rising DIO usually means slower sales, over-ordering or old stock. A falling DIO means cash is coming back sooner.
DIO formula
| Measure | Formula |
|---|---|
| Average inventory | (Inventory at start + inventory at end) ÷ 2 |
| DIO | Average inventory ÷ cost of goods sold × days in period |
| DIO from turnover | Days in period ÷ inventory turnover |
Use 365 days for a year, 90 for a quarter or 30 for a month, and the cost of goods sold (COGS) for that same period.
Inventory turnover ratio
The inventory turnover ratio shows how many times you sell through your average stock in a period. Inventory turnover = cost of goods sold ÷ average inventory. A turnover of 6 over a year means you replace your stock about every two months.
How to calculate inventory turnover
- Take inventory at the start and end of the period from your balance sheet or stock count.
- Add them and divide by 2 to get average inventory.
- Take cost of goods sold for the same period from your profit and loss statement.
- Divide cost of goods sold by average inventory.
If your stock swings a lot through the year, average the month-end figures instead of just the start and end.
DIO vs inventory turnover vs DSI
They measure the same thing from two sides. Turnover counts how many times stock sells through; DIO counts how many days one cycle takes. DSI is another name for DIO. Higher turnover always means lower DIO.
Cash conversion cycle (CCC)
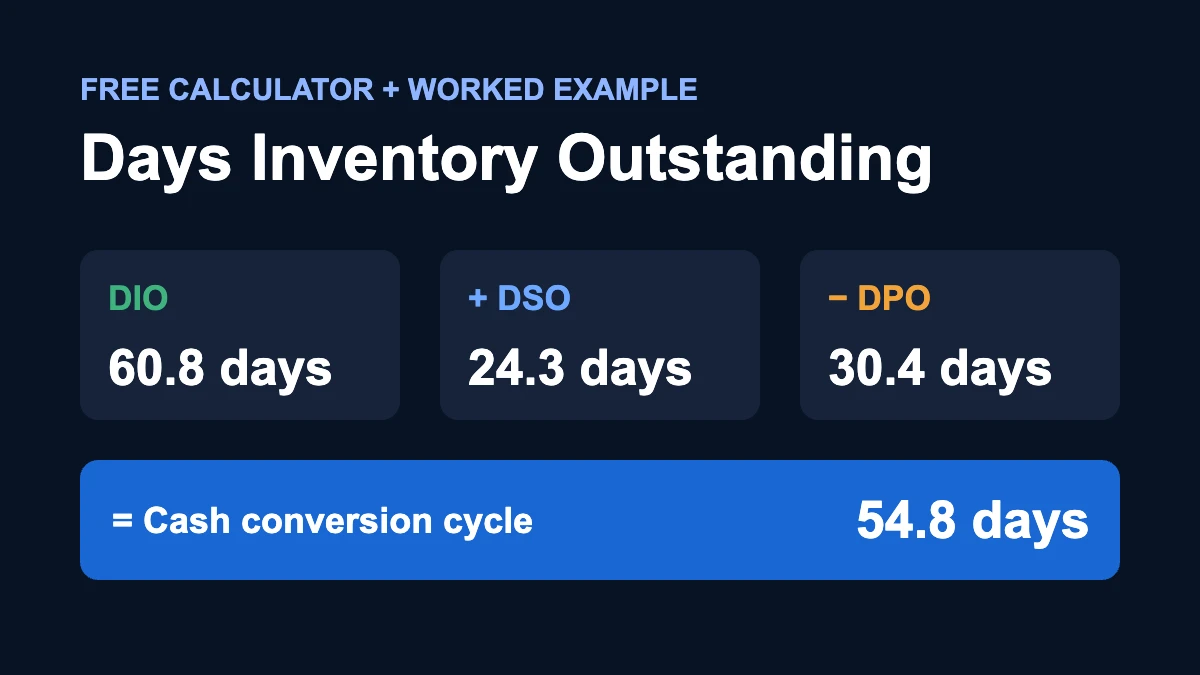
The cash conversion cycle is the number of days between paying for stock and collecting cash from customers. CCC = DIO + DSO − DPO. DSO (days sales outstanding) is how long customers take to pay you. DPO (days payable outstanding) is how long you take to pay suppliers. A shorter cycle means you need less cash to run the business.
| Measure | Formula |
|---|---|
| DSO | Accounts receivable ÷ revenue × days |
| DPO | Accounts payable ÷ cost of goods sold × days |
| CCC | DIO + DSO − DPO |
A negative CCC means suppliers effectively fund your stock. It is common in businesses that sell for cash and buy on credit, such as supermarkets and cafés.
Worked example: a small retailer
A shop starts the year with $36,000 of stock and ends it with $54,000. Its cost of goods sold for the year is $270,000 and revenue is $405,000. Customers owe it $27,000 on average, and it owes suppliers $22,500.
| Step | Calculation | Result |
|---|---|---|
| Average inventory | (start + end inventory) ÷ 2 | 45,000 |
| Inventory turnover | COGS ÷ average inventory | 6.0× |
| DIO | average inventory ÷ COGS × 365 | 60.8 days |
| DSO | receivables ÷ revenue × 365 | 24.3 days |
| DPO | payables ÷ COGS × 365 | 30.4 days |
| Cash conversion cycle | 60.8 + 24.3 − 30.4 | 54.8 days |
| Cash per day of DIO | COGS ÷ 365 | 740 |
If the shop brings DIO down by 10 days, it needs about $7,400 less cash in stock. That is cash it can use for rent, payroll or a slow month.
What is a good DIO?
There is no single good DIO; it depends on what you sell. A bakery or café with perishable stock may turn its stock in days, while a furniture or spare-parts business can hold stock for months and still be healthy. The useful comparisons are your own DIO over time and businesses that sell the same kind of product. If your DIO rises for two or three months in a row while sales stay flat, find out why before you place the next order.
How much cash is tied up in your stock?
Divide your yearly cost of goods sold by 365. That is roughly the cash each day of DIO holds. Multiply it by your DIO to see your average cash in inventory. For the shop above: $740 × 60.8 ≈ $45,000, which is its average inventory. This is why stock problems show up as cash problems first. Read more in how inventory affects cash flow.
6 ways to lower DIO without running out of stock
- Rank items by sales. Order your fast sellers more often, in smaller amounts.
- Clear slow stock. Bundle, discount or return items that haven’t sold in 90 days.
- Order against a forecast, not a feeling: base orders on expected sales for the next weeks.
- Shorten supplier lead times, or agree smaller minimum orders.
- Set reorder points for your top items so you don’t overbuy “just in case”.
- Check the count. Lost or miscounted stock inflates DIO on paper.
Common mistakes
- Using revenue instead of cost of goods sold, which makes DIO look lower than it is.
- Mixing periods, such as yearly cost of goods sold with one month’s inventory.
- Using only the ending inventory in a seasonal business.
- Comparing your DIO with businesses that sell very different products.
- Cutting stock so far that you lose sales. The goal is less idle stock, not empty shelves.
From one number to a 12-month cash plan
DIO tells you where you are today. A cash forecast shows what happens next: when the next stock order lands, when customers pay, and whether the bank balance holds up. Start with the free 12-month cash flow forecast template. Or build your plan in BznsBuilder: set how many days customers take to pay, how many days you take to pay suppliers and how many months of stock you keep, and the cash flow forecast updates month by month, including the change in inventory. On the Build and Decide plans you enter your actual figures each month and the dashboard compares them with the forecast line by line.
Tip: the app takes stock in months, so a DIO of 61 days is about 2 months of stock.
Frequently asked questions
What does DIO mean in finance?
DIO stands for days inventory outstanding: the average number of days a business holds inventory before selling it.
Is a high or low DIO better?
Lower is usually better for cash, because stock turns back into money sooner. If it is too low, you may run out of stock and lose sales.
What is the difference between DIO and DSI?
None. Days sales of inventory (DSI) and days inventory outstanding (DIO) are two names for the same measure.
How do I calculate DIO from inventory turnover?
Divide the days in the period by the turnover. For a turnover of 6 over a year, DIO is 365 ÷ 6 ≈ 61 days.
Should I use sales or cost of goods sold?
Use cost of goods sold. Inventory is recorded at cost, so dividing by sales mixes cost with price and understates DIO.
Can the cash conversion cycle be negative?
Yes. If customers pay you before you pay suppliers, the cycle is negative and suppliers are effectively financing your stock.
How often should I check DIO?
Monthly is enough for most small businesses. Watch the trend over three to six months rather than one month’s number.
See how your stock days affect the next 12 months of cash. BznsBuilder builds a monthly cash flow forecast from your sales, costs, payment terms and stock levels.