
How to Make a Sales Forecast: Formula, Steps and a Worked Example

A sales forecast estimates how much you will sell in each future month. For each product or service, multiply the units you expect to sell by the price, then add the revenue streams together. Small businesses get the most realistic number by building it bottom-up: start from the customers you can actually reach, not from a share of the whole market.
Key takeaways
- Formula: monthly sales = units × price, for each revenue stream.
- Forecast 3 to 10 revenue streams, monthly for the first 12 months, then yearly.
- Bottom-up units = people you reach × visit rate × conversion rate.
- Compare the forecast with actual sales every month and update it.
What is a sales forecast?
A sales forecast is your best estimate of the revenue you will earn in each coming month, broken down by what you sell. It is the starting point of every financial plan: your profit and loss, cash flow and hiring decisions all depend on it.
People also call it a sales projection or revenue forecast. A forecast is different from a target. A target is what you would like to sell. A forecast is what you expect to sell, based on assumptions you can explain and test.
Sales forecast formula
Sales forecast (month) = units sold × price per unit, added up for every revenue stream
Units (bottom-up) = people you reach × visit rate × conversion rate
Here is how the second line works. A social media campaign reaches 60,000 people. 2% of them visit your online store, which gives 1,200 visits. 3.3% of visitors buy, so you get about 40 orders. If each order is a candle at $20, that stream forecasts $800 of sales for the month.
Every number in that chain is an assumption you can check: ad reach from the platform, visit rate from your analytics, conversion rate from your first weeks of sales or from customer interviews.
How to make a sales forecast in 6 steps
- List 3 to 10 revenue streams. Group similar products or services. An event planner might use corporate events, private parties and weddings, not one line for every type of event.
- Choose a unit for each stream. Orders, hours, subscriptions, covers or projects. Pick whatever you actually count when you sell.
- Estimate monthly units bottom-up. Start from how many people you can reach and how many of them buy, as in the formula above. If you already have sales history, start from last year’s months instead.
- Set a realistic price per unit. Use the average price after discounts, not the list price.
- Add seasonality. Mark the months when demand rises or falls, such as Ramadan and Eid, back-to-school, the holidays or summer.
- Subtract direct costs. Take off the cost of each unit to see gross profit, then check when the cash actually arrives.
Should you forecast in units or in money? In units whenever you can. Units make your assumptions visible, and they are easier to compare with what really happens.
Sales forecast example: 6 months for a small online store
An online store sells two products: scented candles at $20 and diffuser refills at $10. Candle sales come from social media ads, using the funnel above. Refill sales grow as first-time buyers come back. Month 4 is the store’s peak season, such as Ramadan or the holidays. Direct costs (product, packaging and delivery) are 40% of sales.
| Month | Candles (units) | Candle sales (USD) | Refills (units) | Refill sales (USD) | Total sales (USD) | Direct costs (40%) | Gross profit |
|---|---|---|---|---|---|---|---|
| 1 | 40 | 800 | 15 | 150 | 950 | 380 | 570 |
| 2 | 46 | 920 | 22 | 220 | 1,140 | 456 | 684 |
| 3 | 53 | 1,060 | 30 | 300 | 1,360 | 544 | 816 |
| 4 (peak season) | 80 | 1,600 | 38 | 380 | 1,980 | 792 | 1,188 |
| 5 | 61 | 1,220 | 45 | 450 | 1,670 | 668 | 1,002 |
| 6 | 55 | 1,100 | 50 | 500 | 1,600 | 640 | 960 |
| Total | 335 | 6,700 | 200 | 2,000 | 8,700 | 3,480 | 5,220 |
Three things to notice. Sales grow every month because refills from repeat customers add to new candle orders. The peak month alone brings in 23% of the six-month total, so the store must buy stock before it starts. And month 6 is lower than month 5 because candle orders fall back after the peak.
Downside check: if only 2.2% of visitors buy instead of 3.3%, candle units fall by about a third. That is about 112 fewer candles, or $2,240 less in sales over six months. Always keep a weaker case next to your base forecast.
The numbers are illustrative. Use your own reach, conversion rates, prices and costs.
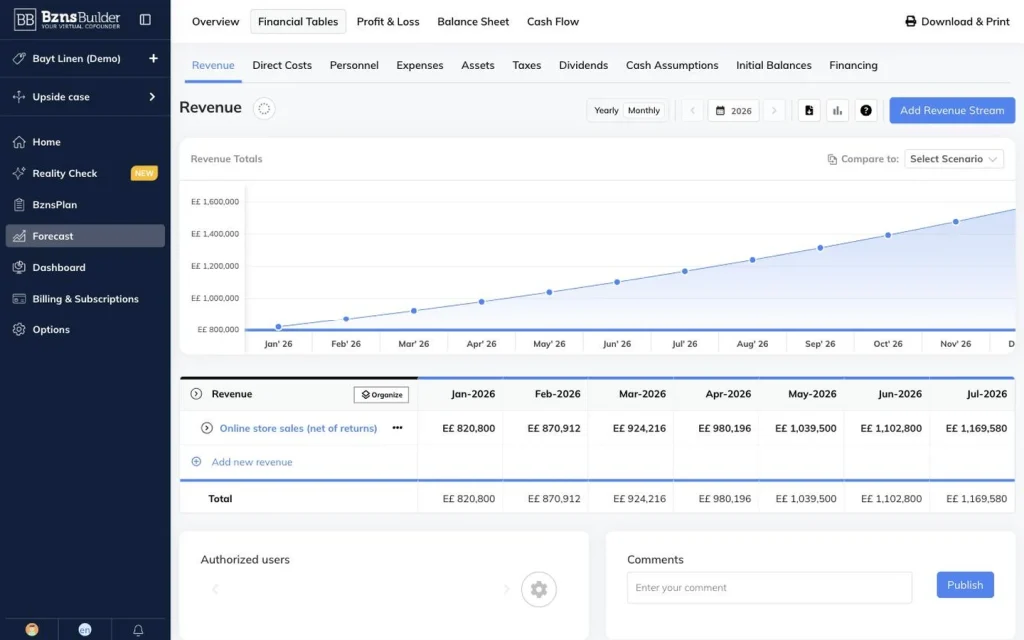
You can build this forecast in BznsBuilder: add each revenue stream, set units and prices by month, and see the effect on profit and cash straight away. Start a 7-day free trial, no credit card needed.
Sales forecasting methods compared
There are four common ways to forecast sales. Most small businesses start bottom-up and use the others as a cross-check.
| Method | How it works | Best for | Watch out for |
|---|---|---|---|
| Bottom-up | Reach × visit rate × conversion rate × price | New and small businesses | Optimistic conversion rates |
| Historical growth | Same month last year × (1 + expected growth) | Businesses with 12+ months of sales | Assuming the past repeats |
| Top-down | Market size × the share you expect to win | Sense-checking a bottom-up forecast | “1% of a huge market” with no plan to reach it |
| Pipeline | Value of each open deal × chance it closes | B2B companies with a sales team | Deals that stay “likely” for months |
A classic Harvard Business Review article, How to Choose the Right Forecasting Technique, makes the same point: the right method depends on the data you have and the decision the forecast supports.
Sales forecast for a business plan
Lenders and investors read the sales forecast first, because every other number in your plan depends on it. The U.S. Small Business Administration’s business plan guide suggests a five-year outlook and, for the first year, quarterly or even monthly projections. Show the assumptions next to the numbers, so a reader can see where each figure comes from.
Our free business plan template has a financial section ready for this table. If you prefer a spreadsheet, SCORE publishes a 12-month sales forecast template.
No sales history yet?
Use the bottom-up method above and test your conversion rate with a small campaign or customer interviews before you rely on it. Our guide on how to project sales for a new business walks through a first forecast, from the bottom-up estimate to the cash you need.
How far ahead to forecast and how to check it
Forecast monthly for the first 12 months, then yearly for years two and three. Beyond that, keep it simple: the further out you go, the less each number means.
- Compare with actuals every month. When a month closes, put actual sales next to the forecast and ask why they differ. Our guide to plan vs actual analysis shows how.
- Turn sales into cash timing. Sales are not cash until customers pay. Carry the forecast into a 12-month cash flow forecast.
- Know your floor. Check the minimum sales you need each month with the break-even point.
- Keep budget and forecast apart. A budget is the plan you commit to; a forecast is updated as you learn. See budget vs forecast.
Charts help here. A simple line of forecast against actual sales shows a drift weeks before it shows up in your bank balance.
Frequently asked questions
How do you calculate a sales forecast?
For each product or service, multiply the units you expect to sell in a month by the average price per unit. Add the results for all revenue streams to get total monthly sales. Repeat for each month, adjusting units for growth and seasonality.
What is the difference between a sales forecast and a sales projection?
In everyday use they mean the same thing: an estimate of future sales. Some people use projection for a hypothetical scenario (“what if we open a second shop?”) and forecast for the expected outcome of the current plan.
Which sales forecasting method is best for a small business?
Bottom-up forecasting. It starts from the customers you can realistically reach and convert, so every number can be checked. Use top-down only as a cross-check, and switch to historical growth once you have a year of sales data.
How accurate should a sales forecast be?
No forecast is exact. What matters is that the assumptions are explicit and that you update the forecast when actuals come in. If actual sales keep missing the forecast in the same direction, change the assumption behind it rather than waiting.
What data do I need to forecast sales?
Your revenue streams, prices, and an estimate of monthly units. For units, use past sales if you have them; otherwise use reach, visit and conversion rates from ads, analytics, pilots or customer interviews, plus any seasonal patterns in your market.
Should I forecast in units or in money?
Forecast units first, then multiply by price. Units show the assumption behind each number, make it easier to plan stock and staff, and let you see whether a miss came from volume or from price.
Build your sales forecast in BznsBuilder Add your revenue streams, set units and prices by month, and see profit and cash update as you go. 7-day free trial, no credit card needed.