
How to Forecast Without Historical Data: A 4-Step Method for New Businesses

To forecast without historical data, build the forecast from drivers you can estimate instead of past results. There are 4 steps: list how you will make money and what you will spend; estimate each line from numbers you can count (people you can reach, how many buy, what they spend); shape those numbers into a monthly plan; and work out how much cash you need until sales cover costs. Then test a downside and replace estimates with actual results as they come in.
Formula: Revenue = people you reach × % who visit × % who buy × average spend
Key takeaways
- Start from what you can control and count (outreach, visits, conversion, average spend), not from a share of the whole market.
- Keep it simple: 3–6 revenue lines and 3–6 expense lines are enough for a first forecast.
- Cash timing matters as much as profit: find the month where cash is lowest to see how much funding you need.
- Test at least one downside scenario, then update the forecast monthly with real numbers.
The 4 steps at a glance
- Step 1: List how you will make money and what you will spend: 3–6 revenue lines and 3–6 expense lines.
- Step 2: Estimate each line from drivers you can count, not from a share of the whole market.
- Step 3: Shape the numbers into a monthly plan that matches your goals, your seasons and the way your costs behave.
- Step 4: Find your lowest cash month and work out how much funding covers it.
This guide is for founders with no sales history yet: a new business, a new branch or a new product line. Each step takes about 30–45 minutes, so you can do one per sitting. The goal is not to predict the future perfectly. It is to make the assumptions behind the business visible enough to test and update. If you are new to the topic, start with what financial forecasting is and why it matters.
Before you start:
- Aim for a first version, not a perfect one. You will revise it.
- Write each assumption next to its number, so you can see later which guess was wrong.
- Show the draft to one person who knows your market and ask what looks too optimistic.
Step 1: List how you will make money and what you will spend
Before you work with numbers, decide which revenue and expense lines your forecast will have. Spend a few minutes listing the ways you will make money and the things you will pay for. Aim for 3–6 revenue lines and 3–6 expense lines. If you have more, group similar items: fewer lines make the forecast easier to manage and adjust.
Example: if you plan to sell phone accessories in blue, red, green and metallic magenta, don’t list each colour. Group them into one revenue line called “phone accessories”. Do the same with costs: electricity, water and internet can sit under “utilities”.
Step 2: Estimate each line from numbers you can count
Now add a monthly estimate to each line. Work on one side at a time: finish all the revenue lines, then all the expense lines, or the other way round if costs such as rent and salaries are easier to pin down. These are educated guesses. They will change as you learn.
Revenue. Revenue is usually the hardest part to estimate. Our guide on how to make a sales forecast covers the methods in more detail; for a new business, the bottom-up approach below is the place to start.
Starting with a large market size—like predicting you’ll reach 40,000 people within 10 miles of your business—can lead to unrealistic expectations. Instead, start by evaluating your own capabilities and actions as a business owner and work your way up from there.
Here are some questions to help guide your process:
- How many potential customers can you reach out to?
- How many will respond or visit?
- How many of those will end up purchasing from you?
- What is the average amount they will spend?
Example:
Let’s say you are opening a new café in Austin, Texas. Based on foot traffic and marketing outreach, you predict that within one month:
- 46,000 people will learn about your café.
- 8% (3,680) will visit the store.
- Of those who visit, 70% (2,576) will make a purchase.
- On average, each customer will spend $8.
That gives a first-month revenue estimate of 2,576 × $8 = $20,608. This bottom-up method (reach → visits → purchases → average spend) is easier to test and defend than a top-down guess such as “we will win 1% of the market”. The worked example below carries these numbers through to costs, profit and cash.
Expenses. For each expense line, note how much you expect to pay and when:
- Keep the types simple for now. You don’t need to split fixed, variable and direct costs yet; that comes in Step 3.
- Include your own salary. Even if you won’t pay yourself at first, note when and how much you expect to take.
- Put staff costs on their own line. If you plan to hire, keep salaries under “staff” or “payroll” so you can see what each hire does to costs and cash.
If you have been at it for more than 30–45 minutes, stop and come back to Step 3 in a new sitting. A break makes it easier to spot numbers that don’t look right.
Step 3: Shape the numbers into a monthly plan
Now check whether the numbers tell the story of your business. Imagine explaining the plan to a friend or an investor: what happens this month, next month and over the year, and what results do you expect? Go through the forecast month by month. Where the numbers don’t match that story, change the revenue or expense line that is out of step.
- Look at it as a chart. Revenue, costs, profit and cash side by side show quickly what each change does.
- Question a “hockey stick”. If costs look too low or sales grow too fast, bring them back to something you can explain.
- Follow the losses. Early losses are normal. Check whether they narrow as sales grow, but don’t treat that alone as proof that the business will become profitable.
Then sort the lines so they fit standard financial statements. Ask three questions about revenue:
- Are there costs tied directly to each sale? Materials, packaging or delivery labour are direct costs, often called cost of goods sold (or cost of services). Keep them apart from other expenses and, if possible, set them as a percentage of each revenue line so they move when revenue changes.
- Will customers buy again? For subscriptions or repeat customers, forecast recurring revenue and the share of customers you expect to lose each month (churn). Start with a simple percentage and adjust it as results come in. Stripe’s guide to calculating churn rate explains the maths.
- Will sales change with the seasons? Many businesses have busy and quiet months. Until you have your own history, Google Trends shows when interest in your product or industry rises and falls.
And sort expenses into four groups:
- Fixed costs stay the same each month, such as rent and insurance.
- Variable costs change from month to month, such as marketing or utilities.
- Staff costs sit on their own so you can see what each hire does to costs and cash.
- Assets such as vehicles or machinery may be recorded on the balance sheet instead of expensed at once, depending on your accounting policy. The cash leaves when you pay, while depreciation spreads the cost over time in your profit and loss.
If you are unsure where a cost belongs, leave it unclassified for now. Forecasting software such as BznsBuilder builds the P&L, cash flow and balance sheet from these lines as you enter them.
Step 4: Work out how much cash you need
Now look at cash. A first forecast often shows negative cash flow in the early months. That is expected: finding out how much cash you need is one of the reasons to build the forecast. If you pitch to investors, this number becomes your ask: see the financial slides of a pitch deck.
- Add your starting cash. This is the money you plan to put in: savings, a bank loan, money from friends or family, or a mix. If you haven’t secured any yet, leave it at zero.
- Check your cash position and runway. Is the starting cash enough to cover costs until sales come in? How much do you spend each month? Even with sales, do you run out of cash, and when? The aim is to stay covered until cash coming in exceeds cash going out. The cash runway calculator shows how many months your cash will last.
- Find the funding gap. Project cash in and out month by month and find the largest cumulative shortfall. Add a cushion for delays and surprises. The result is a planning estimate, not a precise figure. Our guide to estimating startup costs walks through it with a worked example and a calculator. The SBA’s guide to calculating your startup costs is a useful checklist of what to include.
- Decide whether you need more funding. Ask yourself whether you are comfortable raising or borrowing that amount. If not, revisit revenue and costs and look for ways to start with less. If you are, compare funding options and the terms you can accept.
If you are considering a loan, build a second scenario that includes it and its repayments, and compare it with your base case to see how repayments affect future cash.
Worked example: a first 3-month forecast for a new café
Illustrative example only. All figures are fictional assumptions, not benchmarks for cafés in the US or anywhere else.
Here is how the café from Step 2 turns its guesses into a forecast it can test. Customers pay at the till, so sales become cash in the same month.
Assumptions
- People who hear about the café: 46,000 in month 1, then 54,000 and 62,000 as marketing builds.
- 8% visit, 70% of visitors buy, average spend $8.
- Direct costs (coffee, milk, food, packaging): 35% of revenue.
- Operating costs: rent $5,000, two staff $7,000, utilities $700, marketing $800 = $13,500 a month. The founder takes no salary yet.
- Starting cash $90,000; equipment and fit-out $55,000, paid in month 1.
| Base case (USD) | Month 1 | Month 2 | Month 3 |
|---|---|---|---|
| Paying customers | 2,576 | 3,024 | 3,472 |
| Revenue | 20,608 | 24,192 | 27,776 |
| Direct costs (35%) | 7,213 | 8,467 | 9,722 |
| Operating costs | 13,500 | 13,500 | 13,500 |
| Operating profit | −105 | 2,225 | 4,554 |
| Equipment (cash out) | 55,000 | 0 | 0 |
| Month-end cash | 34,895 | 37,120 | 41,674 |
The base case reaches a small profit in month 2, and cash is lowest at the end of month 1 ($34,895), right after the equipment is paid for.
Downside scenario: only half as many visitors buy (35% instead of 70%). Revenue falls to $10,304, $12,096 and $13,888, operating losses are $6,802, $5,638 and $4,473, and month-end cash drops to $28,198, $22,560 and $18,087. If the founder wants to keep at least $20,000 in the bank, the downside breaches that buffer in month 3.
That one comparison tells the founder what to work on before opening: a cash cushion or credit line of at least the shortfall, lower fixed costs, or a way to lift conversion (for example, a launch offer). It also shows which assumption matters most here: the share of visitors who buy. That is the first number to replace with real data once the doors open. To see how many months the cash would last in the downside case, calculate the cash runway; to know how many customers cover all the costs, use the break-even calculator.
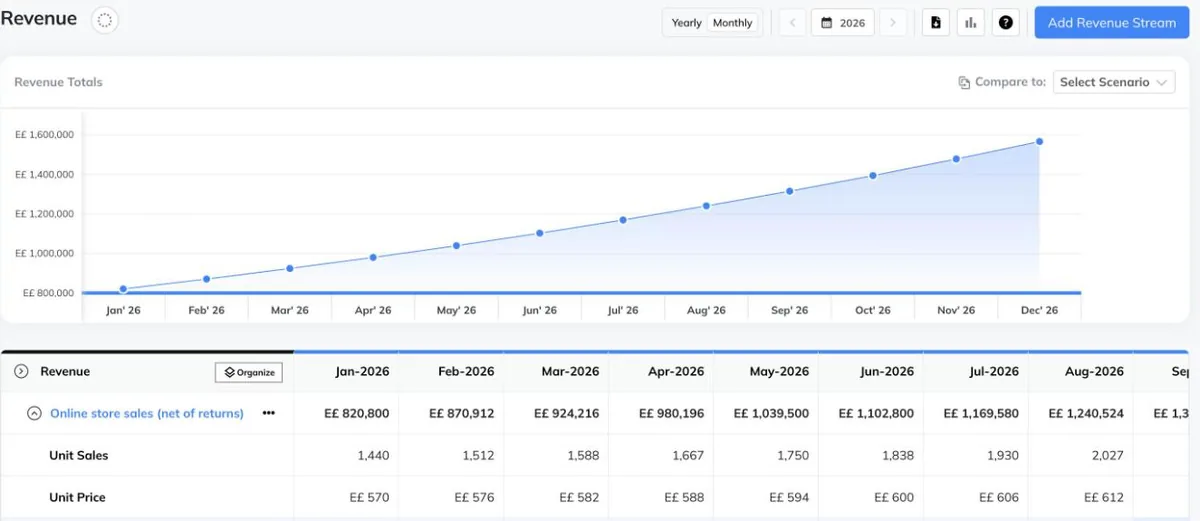
See how forecasting works in BznsBuilder →
Free template: put your own numbers into a 12-month forecast
Once you have your drivers, carry them into a full year. Enter your opening cash and what you expect to receive and pay each month; the sheet carries closing cash forward, finds your lowest month and flags any month below your safety buffer.
For the method behind the sheet, see how to build a 12-month cash flow forecast.
How to project sales for a new business
Project sales for a new business bottom-up first: how many customers you can reach each month, how many will buy and what they will spend. That is the café calculation above. Then check the result from the top down. If your first-year sales would be more than a small share of what similar businesses in your area take in, your conversion or spending assumptions are probably too high.
To make the estimate easier to defend:
- Borrow benchmarks. Suppliers, trade associations, landlords and owners of similar businesses can tell you typical footfall, conversion and average spend.
- Ramp up gradually. New businesses rarely hit full sales in month one. Let customer numbers grow over the first months instead of starting at your target.
- Write a range. Forecast a low, likely and high case, and plan your cash around the low one.
Sales projections are also the starting point of the financial section of a business plan. Our guide to writing a financial plan shows where they fit.
Demand forecasting for a new product: 3 ways to borrow evidence
When a product has never been sold, you can’t forecast demand from its history. Borrow evidence instead of inventing it:
- Comparable products. Start from what a similar product sells, yours or a competitor’s, and adjust for differences in price, reach and season.
- Pre-orders or a waitlist. Count the people who commit before launch, then apply a cautious conversion rate to estimate how many will actually buy.
- A small test batch. Sell a limited run in one channel or location and forecast the next months from how quickly it sells.
Each method gives you a range, not a single number. Forecast a low and a likely case, and order stock for the low one until real sales come in. To see how long that stock will tie up your cash, work out your days inventory outstanding. Non-financial data such as units sold, enquiries or bookings also work as forecast drivers, as long as you turn them into revenue with a price.
Reforecast as actuals arrive
Your first forecast is a set of educated guesses, and every month of trading replaces one of them. At the end of each month, put the actual figures next to the forecast and note which assumption was off: visitors, conversion, spend or costs. Change that driver and let the rest of the year recalculate.
You don’t need to rebuild the model each quarter. Update only the drivers that turned out wrong and keep the rest. Our guide to plan vs actual analysis shows how to read the differences, and budget vs forecast explains how a living forecast differs from a fixed budget.
You’re already better at forecasting than you think
For a new business, a financial forecast provides a structured way to examine assumptions about revenue, costs, and cash flow. Even without historical data, founders can use those assumptions to explore possible outcomes and revise their plans as the business develops.
Once your assumptions are in a forecast, changing one assumption lets you test what it does to the rest of the numbers. BznsBuilder lets founders build financial forecasts and compare what-if scenarios against a base case. Build your forecast and see how your decisions affect cash. Start your 7-day free trial. See how BznsBuilder works in 4 steps.
If you’re not quite ready to invest in a tool but still want to learn more about forecasting for your business, check out these resources:
- Keep your forecast alive: compare results with the plan every month using plan vs actual analysis.
- Turn it into a cash plan: follow how to build a 12-month cash flow forecast.
- Check the quality of your numbers: review the 7 qualities of accurate financial forecasts.
Related guides: plan the next year month by month with the free 12-month cash flow forecast template, find your cash low point with the free tool in our cash flow management guide, see how many months your cash will last with the cash runway calculator, and work out the sales you need to cover your costs with the break-even guide.
Frequently asked questions
How do you forecast sales without historical data?
Build the forecast bottom-up: estimate how many people you can reach, what share will visit or reply, what share will buy and how much each will spend. Multiply those drivers for each month, then replace each estimate with real results as they come in.
Can I forecast using non-financial data like units sold?
Yes. Units, visits, sign-ups, orders and conversion rates are often better starting points than money, because you can count and test them. Multiply units by your expected price to get revenue, and by unit cost to get direct costs.
What is the difference between top-down and bottom-up forecasting?
Top-down forecasting starts from the size of the market and assumes a share of it. Bottom-up forecasting starts from your own capacity and sales activity. For a new business, bottom-up is usually more realistic because it is based on actions you control.
How accurate can a forecast without historical data be?
It will not be exact, and it does not need to be. Its job is to make your assumptions visible, show when cash is lowest and reveal which assumption matters most. Accuracy improves as you update it with actual results.
How often should I update a forecast for a new business?
Every month at first. Compare actual results with the forecast, update the assumptions that were furthest off, and roll the forecast forward so it always looks at least 12 months ahead.
How much funding does a new business need?
Use the forecast to find the largest cumulative cash shortfall, the lowest point your cash reaches, then add a contingency for delays or slower sales. Test a downside scenario before you settle on an amount.
What tools let you reforecast without starting from scratch?
Any tool where the forecast is built from drivers, so that changing one assumption updates the whole plan. A well-built spreadsheet can do this if every month links to the same assumption cells. Forecasting software such as BznsBuilder keeps the drivers, P&L, cash flow and balance sheet connected, so a reforecast means editing a few inputs and comparing versions.
How many years of historical data do you need for a financial model?
Analysts usually like two to three years to see trends and seasonality. A new business has none, so it builds the model from drivers instead (customers, price, costs and timing) and adds actual months as they happen. After 12 months you have enough history to check your seasonality assumptions.
Build your first forecast without history
Start from assumptions, refine as you learn.
- P&L
- Cash flow
- Scenarios