
How to Calculate the Break-Even Point for a Small Business

The break-even point is the sales level where revenue equals your fixed and variable costs, so operating profit is zero. To calculate it, divide your fixed costs by the contribution margin per unit (selling price minus variable cost per unit). For example, $3,600 of monthly fixed costs ÷ ($1,000 price − $400 variable cost) = 6 sales a month, or $6,000 of revenue. Use the free break-even calculator below to run your own numbers.
Key takeaways
- Break-even units = fixed costs ÷ (selling price − variable cost per unit).
- Break-even revenue = fixed costs ÷ contribution-margin ratio.
- Round break-even units up to whole units, and recalculate whenever your price, variable costs or fixed costs change.
- Breaking even on profit does not mean you have enough cash: customer payment timing can still leave a gap.
Break-even point formula
Break-even analysis needs three numbers for the same period: your fixed costs, your selling price per unit and your variable cost per unit. A unit can be a product, an order, a project or a customer. For a simple product or service, use these formulas (the U.S. Small Business Administration uses the same units formula):
| What you want | Formula | Example |
|---|---|---|
| Contribution margin per unit | Selling price − variable cost per unit | $1,000 − $400 = $600 |
| Contribution-margin ratio | Contribution margin ÷ selling price | $600 ÷ $1,000 = 60% |
| Break-even point in units | Fixed costs ÷ contribution margin per unit | $3,600 ÷ $600 = 6 units |
| Break-even point in revenue | Fixed costs ÷ contribution-margin ratio | $3,600 ÷ 60% = $6,000 |
| Units for a target profit | (Fixed costs + target profit) ÷ contribution margin per unit | ($3,600 + $1,200) ÷ $600 = 8 units |
| Margin of safety | (Expected sales − break-even sales) ÷ expected sales | ($8,000 − $6,000) ÷ $8,000 = 25% |
Those calculations are useful. But they answer only one question: how much do I need to sell to cover the costs in this model?
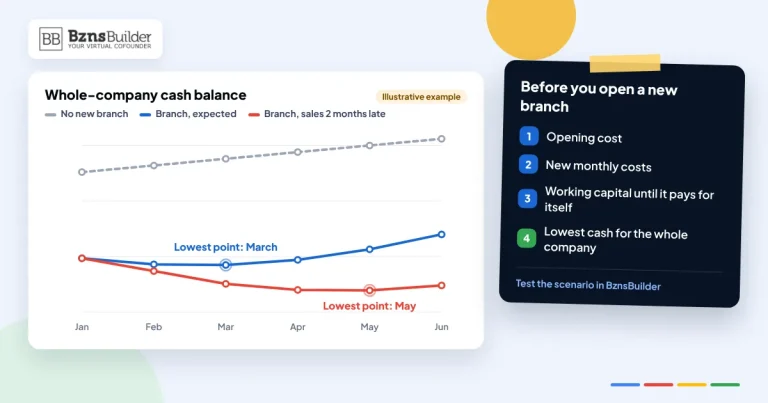
They do not answer another question that matters just as much to a founder: will I have enough cash at the right time to keep operating?
That is why break-even belongs inside a forecast, not on its own.
Free break-even calculator
Enter your numbers for one period (for example, one month). It starts with the example used in this guide.
You need 6 sales a month to break even. See which month you get there, and whether your cash lasts until then.
Start free for 7 days · no credit cardBreak-even covers costs in the model. It doesn't show whether you'll have enough cash while customers pay later. The calculation runs in your browser, and nothing you enter is sent or saved.
1. Start by separating fixed and variable costs
The formula works only if the inputs make sense.
Fixed costs are costs that do not change directly with each extra unit you sell over the period you are modeling. Examples can include rent, a baseline level of salaries, insurance and software subscriptions.
Variable costs rise as sales or production rise. Depending on the business, that might include materials, packaging, delivery, transaction fees, subcontractor time or another cost that is directly tied to each sale.
Some costs are mixed. A utility bill, for example, may have a minimum monthly charge plus a usage element. Where practical, separate the fixed and variable parts rather than forcing the whole cost into one bucket.
The period matters too. If you are calculating monthly break-even, use monthly fixed costs and per-unit economics that belong to the same period.
If your selling price is still moving, first work through how price relates to cost and customer value. BznsBuilder’s guide to pricing products and services is a useful companion to this calculation.
2. Calculate contribution margin
Contribution margin tells you how much of each sale is left after the variable cost of delivering that sale.
Imagine a small B2B service company. Each completed project sells for $1,000 and has $400 of delivery costs that vary with each project.
Illustrative example:
- Selling price per project: $1,000
- Variable cost per project: $400
- Contribution margin per project: $600
So:
$1,000 − $400 = $600 contribution margin per project
The contribution-margin ratio is:
$600 ÷ $1,000 = 60%
That 60% is the share of each sales dollar that remains to cover fixed costs and, after those fixed costs are covered, profit.
3. Calculate break-even units and break-even revenue
Now assume the same business has $3,600 of fixed operating costs per month.
Break-even units are:
$3,600 ÷ $600 = 6 projects per month
Break-even revenue is:
$3,600 ÷ 60% = $6,000 per month
The two answers tell the same story from different angles. Six projects at $1,000 each produce $6,000 of revenue.
At that level:
| At 6 projects a month | Amount |
|---|---|
| Revenue (6 × $1,000) | $6,000 |
| Variable costs (6 × $400) | −$2,400 |
| Contribution margin | $3,600 |
| Fixed costs | −$3,600 |
| Modeled operating profit | $0 |
If your “unit” must be a whole item, order, project or customer, round the theoretical unit result up, not down. A formula that says 6.2 projects does not mean six projects are enough.
Worked example: break-even for a small restaurant
A small US restaurant has an average bill of $30. Food, packaging and delivery-app commission cost $10 per bill, so each bill contributes $20 (a 66.7% contribution-margin ratio). Rent, salaries and utilities come to $24,000 a month.
- Break-even bills: $24,000 ÷ $20 = 1,200 bills a month, about 40 a day over 30 days.
- Break-even revenue: $24,000 ÷ 66.7% = $36,000 a month.
If a delivery app raises its commission by $2 a bill, the contribution falls to $18 and break-even rises to 1,334 bills. Small cost changes move the target more than most owners expect.
4. What break-even analysis tells you
Break-even is a threshold, not a verdict on the whole business.
Under your assumptions:
- below break-even: contribution margin is not enough to cover the fixed costs in the model;
- at break-even: those modeled costs are covered and operating profit is zero;
- above break-even: each additional unit contributes toward operating profit, assuming the price and cost structure hold.
That is valuable for pricing, capacity planning and sales targets. It is also useful when you are considering a new hire, location, product line or other cost that changes the fixed-cost base.
But break-even is still an accounting economics question. It does not automatically tell you how much cash is sitting in the bank.
Margin of safety: how far can sales fall before you stop covering costs?
The margin of safety measures how far your expected sales sit above break-even:
Margin of safety = Expected sales − Break-even sales
Margin of safety % = Margin of safety ÷ Expected sales
If the example business expects 8 projects a month ($8,000 of revenue) and breaks even at 6 projects ($6,000), its margin of safety is 2 projects, or $2,000. That is 25% of expected sales: sales could fall by a quarter before the business stops covering its modeled costs. A thin margin of safety is a signal to test a downside scenario before you add new fixed costs.
Break-even point for multiple products
Most small businesses sell more than one thing. Use a weighted average contribution margin based on your sales mix. Say 70% of the units you sell are projects ($600 contribution each) and 30% are monthly retainers priced at $500 with $300 of variable cost ($200 contribution each):
- Weighted contribution margin = (70% × $600) + (30% × $200) = $480 per unit
- Break-even units = $3,600 ÷ $480 = 7.5 units in that mix: about 5.3 projects and 2.3 retainers. Round each up.
If the mix shifts toward the lower-margin product, the break-even point rises, so recheck it whenever your mix changes.
5. Why you can break even and still run short of cash
Suppose our illustrative service company completes six projects in a month. On the operating model, that is exactly break-even.
Now add one cash-timing assumption: customers pay 30% in the month the work is completed and 70% the following month.
For the six projects, the same month looks very different on profit and on cash:
| Same month, 6 projects | Profit view | Cash view |
|---|---|---|
| Money in | $6,000 revenue | $1,800 collected (30%) |
| Money out | −$6,000 costs | −$6,000 paid ($2,400 variable + $3,600 fixed) |
| Result | $0 (break-even) | −$4,200 gap |
Before considering opening cash, older receivables, supplier credit, financing or other cash movements, that month has a $4,200 timing shortfall.
The business can therefore be at break-even in the profit model and still need cash to bridge the gap between doing the work, paying the bills and collecting the invoice.
This is the same reason a profitable business can feel cash-poor when receivables grow, inventory is bought before it is sold, or major payments fall due before customer cash arrives. If that distinction is the problem you are seeing, read our guide to profit vs cash flow: why sales rise but cash falls. If stock is part of the gap, see how inventory affects cash flow.
A real cash forecast should include the full picture: opening cash, existing receivables and payables, taxes, capital spending, loan movements and any other relevant cash flows. The $4,200 figure above is deliberately simplified to show the timing effect; it is not a complete company cash forecast.
6. Break-even changes when the business drivers change
Your break-even point is not fixed forever. Change price, direct cost or fixed cost and the answer moves.
Here is what happens to the same illustrative business:
| Scenario | Price / project | Variable cost / project | Contribution margin | Break-even units | Break-even revenue |
|---|---|---|---|---|---|
| Base | $1,000 | $400 | $600 | 6 projects | $6,000 |
| Price 10% lower | $900 | $400 | $500 | 7.2 → 8 whole projects | $6,480 |
| Variable cost rises | $1,000 | $480 | $520 | 6.92 → 7 whole projects | ≈ $6,923 |
This is where break-even becomes a decision tool rather than a one-time calculation.
If you discount your price to win work, how many more projects must you deliver? If supplier or subcontractor costs rise, how much does the sales threshold move? If you add another $1,200 of fixed monthly cost, what sales volume now covers it?
Those are business-driver questions. A strong model lets you change the assumptions and see what happens rather than treating one break-even number as permanent.
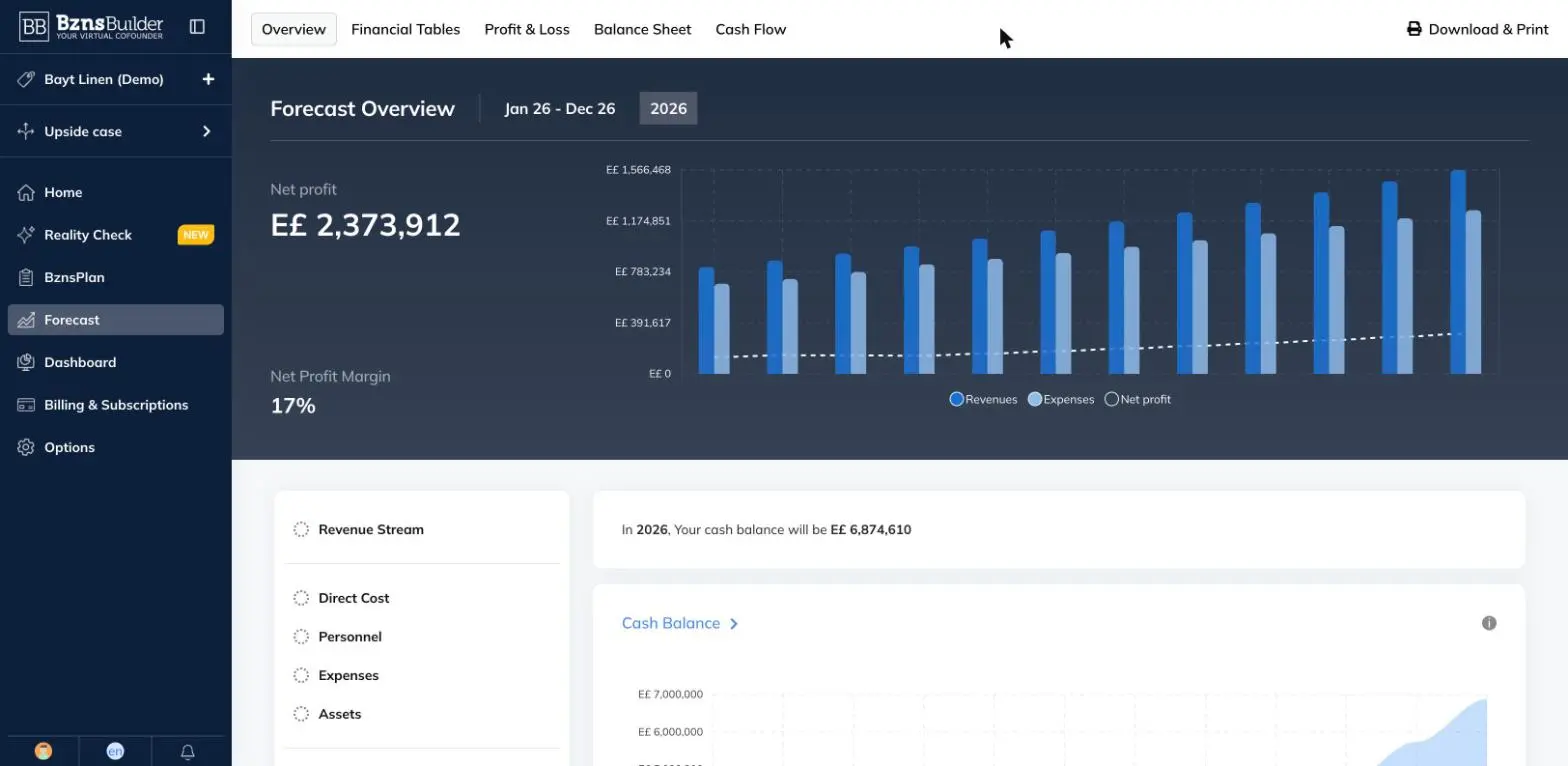
Run these scenarios on your own numbers in BznsBuilder, free for 7 days with no credit card.
7. Put break-even inside a forecast
A break-even calculation is a snapshot. A forecast adds time.
That matters because founders rarely move from “below break-even” to “comfortably above break-even” in one clean jump. Sales ramp up. Prices change. Costs step up. Customers pay late. Equipment or deposits may be paid before the extra revenue arrives.
How long until you break even?
Work it out month by month, using your monthly sales forecast. If the example business sells 2 projects in month 1 and adds one more each month, it reaches break-even in month 5:
| Month | Projects | Contribution | Fixed costs | Profit | Running total |
|---|---|---|---|---|---|
| Month 1 | 2 | $1,200 | −$3,600 | −$2,400 | −$2,400 |
| Month 2 | 3 | $1,800 | −$3,600 | −$1,800 | −$4,200 |
| Month 3 | 4 | $2,400 | −$3,600 | −$1,200 | −$5,400 |
| Month 4 | 5 | $3,000 | −$3,600 | −$600 | −$6,000 |
| Month 5 | 6 | $3,600 | −$3,600 | $0 | −$6,000 |
So the business needs at least $6,000 of funding to cover its losses before it breaks even, and more once late customer payments are added. That figure, not the break-even point itself, decides whether you can afford the plan. To turn it into a full startup budget, see how to estimate startup costs.
Once you know your break-even point, build it into a month-by-month forecast:
- Forecast the number of units, projects or customers you realistically expect each month.
- Apply the selling price and variable cost assumptions.
- Add the fixed costs that start in each month.
- Model when customers actually pay and when supplier, payroll and other payments leave the bank.
- Watch both profit and the closing cash balance.
- Run a downside case with lower sales, lower price, higher cost or slower collections.
If you do not yet have a forward-looking model, start with BznsBuilder’s guide to building your first financial forecast. To turn the result into month-by-month cash, use the steps in how to build a 12-month cash flow forecast, and check how many months your cash lasts while you get there with our guide to calculating cash runway.
8. A founder’s break-even checklist
Before you use the result to make a decision, check all ten items:
- Period: Are the fixed costs monthly, quarterly or annual?
- Fixed costs: Have you included the costs that remain even if sales are zero?
- Unit: Is your unit meaningful — product, order, project, hour or customer?
- Price: Is the selling price realistic after discounts?
- Variable cost: Does it include the costs that genuinely rise with each unit?
- Contribution margin: Have you calculated both the per-unit amount and the ratio?
- Break-even: Have you calculated units and revenue?
- Whole units: If units are discrete, have you rounded up?
- Scenarios: Have you tested what happens when price, volume or cost changes?
- Cash: Have you forecast the timing of collections and payments and checked the lowest cash balance?
If you cannot answer number 10, you know the profit threshold but you do not yet know whether the path to that threshold is affordable.
9. Model the assumptions in BznsBuilder
BznsBuilder is AI business planning and financial forecasting software for SMEs.
You can build a financial forecast around your revenue, direct costs, personnel, expenses and other business drivers, then use what-if scenarios to test different assumptions. That lets you look beyond a single break-even number and see how a change affects the wider forecast, including profit and cash flow.
There is no need to treat break-even as a special feature to get value from the calculation. Work out the economics, put the assumptions into the forecast, then test the decisions that could move them.
Learn more about financial forecasts and scenarios.
Find your break-even month
See when sales cover all your costs.
- P&L
- Cash flow
- Scenarios
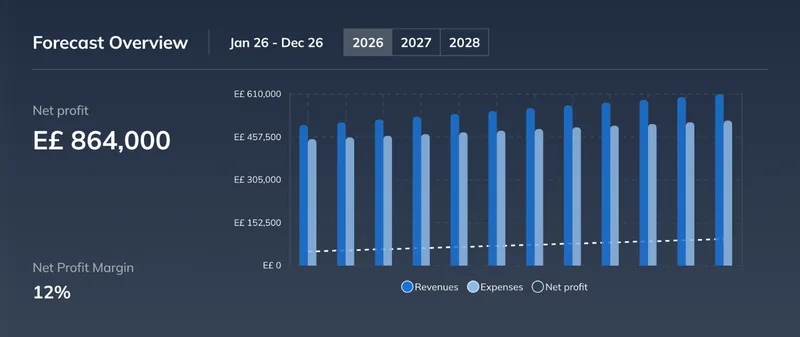
The decision is bigger than the formula
Break-even answers a precise question: what level of sales covers the operating costs in this model?
A cash-flow forecast answers a different one: can the business fund the timing of those sales and costs without running short of cash?
A founder making a real decision needs both.
Frequently asked questions
What is the formula for the break-even point?
Break-even units = fixed costs ÷ (selling price per unit − variable cost per unit). Break-even revenue = fixed costs ÷ contribution-margin ratio, where the ratio is the contribution margin per unit divided by the selling price.
How do you calculate the break-even point in sales revenue?
Divide your fixed costs by your contribution-margin ratio. With $3,600 of fixed costs and a 60% contribution-margin ratio, break-even revenue is $3,600 ÷ 0.60 = $6,000 for the period.
What is the difference between break-even point and margin of safety?
The break-even point is the sales level where profit is zero. The margin of safety is how far your expected sales are above that level, so it shows how much sales can drop before you stop covering your costs.
Should the owner’s salary be included in break-even?
Yes, if the business pays or plans to pay you a regular salary, include it in fixed costs. Leaving it out makes break-even look lower than the level the business really needs.
How often should I recalculate my break-even point?
Recalculate whenever price, variable costs or fixed costs change, for example after a discount, a supplier price rise, a new hire or a rent increase, and each time you update your financial forecast.
Can a business be at break-even and still run out of cash?
Yes. Break-even is measured on profit, not cash. If customers pay after you have paid suppliers, staff and rent, the business can be at break-even and still need cash to cover the gap.